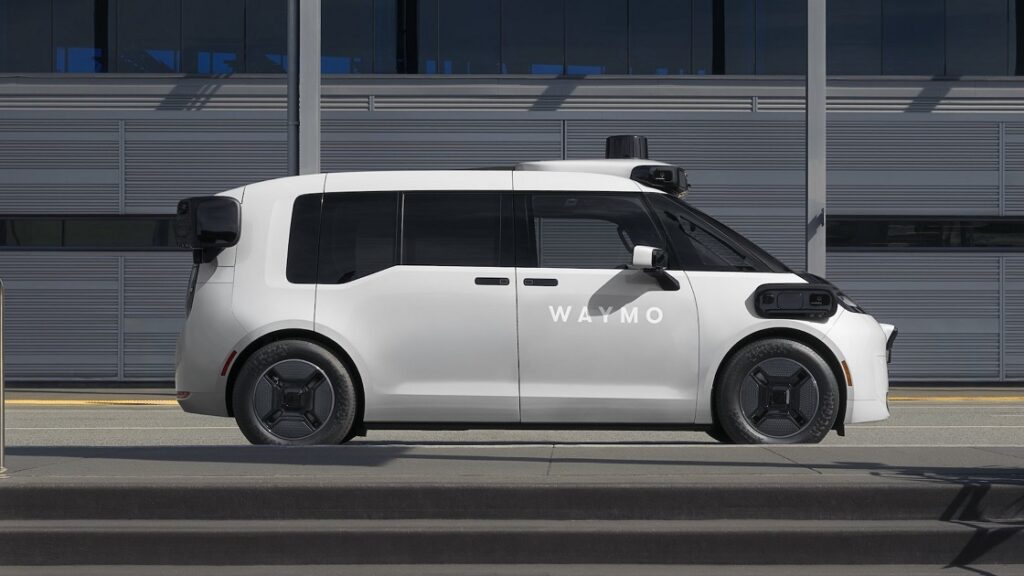
The latest 2026 Waymo safety data release covers 271.3 million fully autonomous miles through June 2026. The company reports 82% fewer injury-causing crashes and 95% fewer serious-injury-or-worse crashes compared with human-driver benchmarks in the same operating areas.
Waymo has released its latest crash and safety data, and the numbers deserve attention. The Alphabet-owned self-driving company has now driven enough fully autonomous miles for its safety record to become much harder to dismiss.
On September 24, 2026, Waymo released an updated analysis covering more than 270 million miles of fully autonomous driving through June 2026. Its detailed Safety Impact dashboard puts the exact figure at 271.3 million rider-only miles — meaning there was no human safety driver behind the wheel.
Those miles were driven across five major U.S. operating areas:
- Phoenix: 92.121 million miles
- San Francisco Bay Area: 82.421 million miles
- Los Angeles: 67.098 million miles
- Austin: 21.064 million miles
- Atlanta: 8.624 million miles
For years, one of the hardest questions in autonomous driving has been simple: Are self-driving vehicles actually safer than human drivers in the real world?
Waymo believes its latest numbers answer in the affirmative.
Key Takeaways from Waymo’s Crash Data Release
1. Waymo’s Safety Data Is No Longer Based on a Small Experiment
Waymo has now accumulated 271.3 million miles of rider-only driving across Phoenix, San Francisco, Los Angeles, Austin and Atlanta.
This is serious progress from ten years ago. Early AV safety claims were often built around simulation, supervised testing and relatively small numbers of driverless miles. Today, Waymo is operating commercial robotaxis at a scale where real-world crash patterns can increasingly be studied.
Waymo described the latest mileage as equivalent to more than 300 human lifetimes of driving.
The company had already crossed 220 million fully autonomous miles by March 2026. At that stage, Waymo said it was driving more than 4 million autonomous miles every week.
The growth has been fast.
Waymo’s co-CEOs Tekedra Mawakana and Dmitri Dolgov said earlier in 2026 that the company completed 15 million rides during 2025 alone, more than tripling its annual ride volume. They also reported more than 400,000 rides per week at the time.
2. The Most Important Number Is the 82% Reduction in Injury Crashes
Waymo reports an 82% lower injury-crash rate than comparable human drivers, equal to an estimated 841 fewer injury-causing crashes across 271.3 million autonomous miles.
Let’s be clear, Waymo Robotaxis still get into crashes. The more useful question is whether they are involved in fewer crashes that hurt people as opposed to human drivers.
According to Waymo’s latest Safety Impact data, the Waymo Driver recorded an 82% lower rate of injury-causing crashes compared with human-driver benchmarks.
Waymo estimates that this translates to 841 fewer injury-causing crashes than would have been expected if human drivers had driven the same number of miles in the same operating areas.
The company says that means at least 841 people avoided injuries, based on the conservative assumption that each avoided injury crash would have injured at least one person.
3. Serious Crashes Are Falling Sharply
Waymo says its vehicles experienced 95% fewer serious-injury-or-worse crashes than the human benchmark. The company’s dashboard translates that into approximately 55 fewer serious-injury-or-worse crashes across its accumulated mileage.
The overall crash rate is also revealing.
Waymo reported:
Waymo serious-injury-or-worse crash rate:
0.01 crashes per million miles
Human benchmark: 0.21 crashes per million miles
That is roughly a 95% difference.
This is so important because not every crash is equally dangerous. A slow parking-area bump and a high-speed intersection collision should definitely not carry the same weight when evaluating road safety.
The real public-safety goal is reducing deaths and serious injuries.
4. Pedestrians, Cyclists and Motorcyclists Are Seeing Some of the Biggest Safety Gains
Waymo reports 93% fewer pedestrian injury crashes, 86% fewer cyclist injury crashes and 82% fewer motorcycle injury crashes than comparable human drivers.
AV safety is not only about protecting people sitting inside autonomous vehicles. The people outside the vehicle matter just as much.
The World Health Organization reported in July 2026 that about 1.16 million people died in road crashes worldwide in 2025. More than half of global road deaths involve vulnerable road users such as pedestrians, cyclists and motorcyclists.
Road crashes also remain the leading cause of death among people aged 5 to 29 worldwide.
5. Intersections Could Be One of Waymo’s Biggest Safety Advantages
Waymo reports a 96% reduction in injury-causing vehicle-to-vehicle intersection crashes compared with its human-driver benchmark.
The benchmark predicted around 405 injury crashes of this type.
Waymo recorded 15.
For intersection crashes involving airbag deployment, Waymo recorded a 95% reduction compared with the benchmark.
Waymo’s earlier peer-reviewed research found a similar result.
A 2025 study based on 56.7 million rider-only miles found a 96% reduction in injury-reported vehicle-to-vehicle intersection crashes and a 91% reduction in intersection crashes involving airbag deployment.
Carol Flannagan, a research professor at the University of Michigan Transportation Research Institute, said in response to Waymo’s June 2026 analysis that the intersection results were “particularly positive” because intersections remain a major safety challenge, especially for vulnerable road users.
6. Comparing Waymo Crash Numbers With Human Driving Is More Complicated Than It Looks
You cannot figure out if Waymo is safer than another car company just by comparing their total number of crashes. The NHTSA specifically warns against doing this because raw crash numbers do not account for how much driving each company actually does.
A company might report higher crash numbers simply because it operates more cars, logs far more miles, or uses better tools to track and report every incident.
NHTSA says:
“Use caution when attempting to compare crash data between entities.”
The reason is because different companies have:
- different fleet sizes;
- different mileage;
- different operating areas;
- different types of roads;
- different vehicle technology;
- different access to crash information;
- different levels of telemetry.
An autonomous vehicle packed with cameras, radar, lidar and onboard logging may record a very small contact that might never appear in ordinary human crash databases.
However, in July 2026, Waymo published research showing that its fleet drives proportionally about four times more miles overnight than the average human driver.
7. Waymo’s Biggest Achievement May Be Repeating the Safety Results Across Different Cities
Waymo’s 2026 safety data shows lower injury-crash rates than local human benchmarks in Phoenix, San Francisco, Los Angeles, Austin and Atlanta.
One of the long-standing questions about robotaxis has been whether strong performance in one carefully selected area can be repeated somewhere else.
Waymo’s latest analysis covers five different metropolitan areas.
The injury-crash rates remain below their corresponding human benchmarks in all five.
For example:
| Operating area | Waymo injury crashes per million miles | Human benchmark |
| Phoenix | 0.56 | 1.95 |
| San Francisco | 0.67 | 6.64 |
| Los Angeles | 0.86 | 2.55 |
| Austin | 0.52 | 3.26 |
| Atlanta | 0.81 | 6.58 |
Source: Waymo Safety Impact dashboard.
Atlanta is particularly interesting because it is one of the newer additions to Waymo’s safety analysis.
By March 2026, Waymo had accumulated more than 5.4 million autonomous miles in Atlanta. Its June update reported 86% fewer injury crashes and 94% fewer airbag-deployment crashes than the Atlanta human benchmark at that stage.
Waymo’s latest dashboard now shows an Atlanta injury-crash reduction of roughly 88% compared with the local benchmark.
Peer Review
One peer-reviewed Waymo study published in Traffic Injury Prevention examined 56.7 million rider-only miles and found statistically significant lower crash rates than human benchmarks for injury crashes, airbag-deployment crashes and serious-injury-or-worse crashes.
Safety claims become more valuable when outside researchers can test the assumptions behind them.
David Zuby, Chief Research Officer at the Insurance Institute for Highway Safety, praised Waymo’s release of detailed mileage and crash information, saying the transparency can support independent research and public trust.
More self-driving companies are eventually expected to do the same.
You May Also Like:
Waymo Expands to Europe: Germany, Spain, Portugal, France, and the UK All Targeted
AV Distribution War: Leading Self-Driving Companies Partnering With Uber and Lyft
Tesla’s Cybercab Launch Event: Is Elon Musk’s Bet Finally Paying Off?

I’m Dr. Brandial Bright, also known as the AVangelist. As a dedicated and passionate researcher in autonomous and electric vehicles (AVs and EVs), my mission is to educate and raise awareness within the automotive industry. As the Founder and Managing Partner of Fifth Level Consulting, I promote the adoption and innovation of advanced vehicle technologies through speaking engagements, consulting, and research as we progress to level 5 fully autonomous vehicles.