Table of Contents
When we think about the future of transportation, safety is often the first concern that comes to mind. After all, can a computer really drive better than a human? The data emerging from Waymo’s autonomous vehicle program is answering this question with a resounding yes—and the numbers are quite impressive.
The Waymo safety impact has become one of the most compelling data in autonomous vehicle technology. With over 127 million fully autonomous miles driven through September 2025, Waymo has accumulated what amounts to more than 150 human driving lifetimes of experience. The data shows that Waymo’s autonomous vehicles are significantly safer than human drivers at reducing crashes and injuries in the cities where they operate.
Let’s walk through what makes this achievement so significant, and why it matters for everyone who shares the road.
Understanding Rider-Only Miles: The Gold Standard for Autonomous Safety Data
Before we dive into the safety numbers, it’s important to understand what makes Waymo’s data so meaningful. The company tracks what they call “Rider-Only” (RO) miles—these are miles driven completely autonomously, without any human driver behind the wheel, in cities where Waymo operates their commercial ride-hailing service.
Rider-Only miles represent real-world autonomous driving where the vehicle is making every decision, navigating actual city streets with passengers aboard, responding to unpredictable traffic situations, and handling the full complexity of urban transportation. These aren’t test miles with safety drivers ready to intervene—this is fully autonomous operation at scale.
The purpose of Waymo’s data analysis is to compare these Rider-Only driving miles directly to human driver benchmarks to determine Waymo’s actual impact on traffic safety today.
The Geographic Footprint: Where the Data Comes From
Waymo’s 127 million Rider-Only miles are distributed across four major metropolitan areas, each with its own unique driving challenges and traffic patterns. Understanding where these miles were driven helps us appreciate the breadth of real-world conditions the Waymo Driver has mastered.
| City | Rider-Only Miles (Through September 2025) | Unique Characteristics |
| Phoenix | 56.535M | Sprawling suburban layout, extreme heat, sun glare challenges |
| San Francisco | 38.816M | Steep hills, dense urban traffic, complex intersections, fog |
| Los Angeles | 25.47M | Heavy congestion, freeway complexity, diverse neighborhoods |
| Austin | 6.337M | Rapid growth, mixed urban-suburban environments, construction zones |
| Total | 127.158M | Diverse urban driving conditions across four major cities |
Phoenix leads the mileage count, reflecting Waymo’s longer operational history there, while Austin represents the newest expansion market. Each city has contributed unique driving scenarios to the collective learning of the autonomous system, from San Francisco’s notoriously challenging steep streets and cable cars to Los Angeles’s complex freeway interchanges and dense traffic.
The fact that the Waymo robotaxi has showcased consistent safety improvements across all these diverse conditions speaks volumes about the robustness of their technology.
Waymo Crash Reductions Across the Board
The data in Waymo’s transparency hub shows that the Waymo Driver is already making roads safer in the places where they currently operate. Specifically, the evidence shows the Waymo Driver is better than humans at avoiding crashes that result in injuries—both of any severity and specifically serious ones—as well as those that lead to airbag deployments.
Overall Crash Reduction Statistics
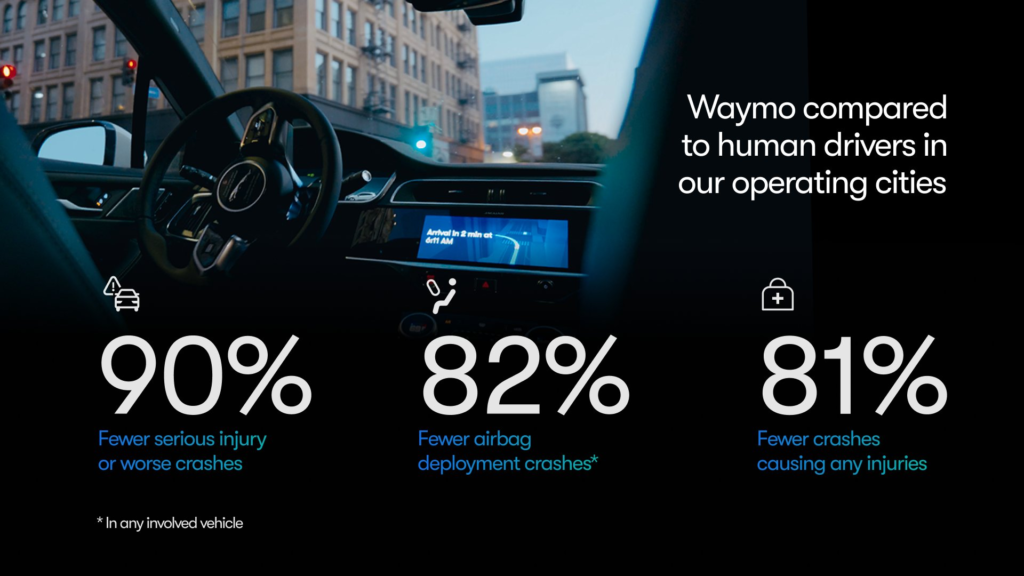
Compared to an average human driver covering the same distance in Waymo’s operating cities, the Waymo Driver achieved:
- 90% fewer serious injury or worse crashes (27 fewer crashes)
- 82% fewer airbag deployment crashes in any vehicle (173 fewer crashes)
- 81% fewer injury-causing crashes (411 fewer crashes)
Here’s what this means: If human drivers only had covered the same 127 million miles in these cities, we would have seen 411 more crashes resulting in injuries to someone. That’s 411 people who avoided pain, trauma, medical bills, and potentially life-altering consequences because they shared the road with autonomous vehicles instead of being involved in crashes with human drivers.
Protecting Vulnerable Road Users
The data becomes even more interesting when we look at crashes involving vulnerable road users—pedestrians, cyclists, and motorcyclists who have little protection in collisions and often suffer the most severe consequences. The Waymo Driver demonstrated remarkable safety improvements for these most at-risk groups:
- 92% fewer pedestrian crashes with injuries (48 fewer crashes)
- 83% fewer cyclist crashes with injuries (28 fewer crashes)
- 80% fewer motorcycle crashes with injuries (20 fewer crashes)
The Waymo Driver’s 360-degree awareness and consistent attention make it exceptionally effective at protecting these vulnerable road users.
Visualizing the Safety Impact: A Comprehensive Comparison
To fully appreciate the magnitude of Waymo’s safety achievements, here’s a table showcasing how the Waymo Driver compares to human benchmarks across multiple crash categories.
| Crash Category | Reduction vs. Human Drivers | Fewer Crashes Prevented | Safety Impact |
| Serious injury or worse crashes | 90% | 27 | Lives saved, catastrophic injuries prevented |
| Airbag deployment crashes | 82% | 173 | Moderate to severe injury prevention |
| All injury-causing crashes | 81% | 411 | Comprehensive injury reduction across severity levels |
| Pedestrian crashes with injuries | 92% | 48 | Protection of most vulnerable road users |
| Cyclist crashes with injuries | 83% | 28 | Safety improvements for vulnerable cyclists |
| Motorcycle crashes with injuries | 80% | 20 | Reduced collisions with motorcyclists |
The above table shows how many fewer Rider-Only crashes Waymo had—regardless of who was at fault—compared to human drivers with the average benchmark crash rate if they were to drive the same distance in the areas where Waymo operates. Results have been rounded to the nearest whole number.
Surface Street Focus
The analysis specifically compares crash rates on surface streets rather than highways. This is significant because urban surface street driving—with its intersections, pedestrians, cyclists, traffic signals, and complex interactions—represents some of the most challenging driving conditions. It’s also where the majority of crashes, especially those involving vulnerable road users, occur.
Comprehensive Reporting Standards
One aspect that makes Waymo’s safety data particularly credible is their comprehensive reporting approach. Waymo reports all crashes involving their vehicles, including minor incidents that might not typically appear in official statistics for human drivers.
As David Zuby, Chief Research Officer at the Insurance Institute for Highway Safety (IIHS), noted:
“By making detailed information about crashes and miles driven publicly accessible, Waymo’s transparency will not only support independent research but foster public trust. We hope other companies developing and deploying automated driving systems follow suit.”
This transparency means we can trust the numbers aren’t cherry-picked or selectively reported. Even with this conservative, comprehensive approach to crash reporting, the Waymo Driver still displays significant safety advantages over human drivers.
Eliminating the Root Causes of Human Crashes
The National Highway Traffic Safety Administration estimates that human error contributes to approximately 94% of serious crashes. The most common factors—distraction, drowsiness, impairment, speeding, aggressive driving, and misjudgment—simply don’t apply to the Waymo Driver.
The autonomous system doesn’t glance at a phone, doesn’t drive drowsy after a long day, never operates under the influence of alcohol or drugs, doesn’t speed to make up time, and doesn’t make emotional decisions in traffic. These eliminated risk factors account for the vast majority of crashes, which helps explain why we’re seeing such substantial safety improvements.
Constant 360-Degree Vigilance
While human drivers primarily focus on what’s directly ahead, with occasional glances to mirrors and blind spots, the Waymo Driver simultaneously processes information from 29 cameras, radars, and lidar sensors covering every angle around the vehicle. This comprehensive perception system operates continuously, without lapses in attention, tracking and predicting the behavior of dozens of road users at once.
This is particularly important for protecting vulnerable road users. The Waymo Driver can simultaneously track a pedestrian crossing behind the vehicle, a cyclist approaching from the side, and vehicles in adjacent lanes—all while maintaining awareness of traffic signals, road conditions, and potential hazards ahead. Human drivers, no matter how skilled or attentive, simply cannot maintain this level of comprehensive awareness.
Reduced Secondary Crashes
When crashes occur on busy streets, they frequently lead to additional collisions as drivers approach the scene—either because of distraction from “rubbernecking” or because sudden braking propagates back through traffic. By preventing the initial crash, the Waymo Driver also prevents these cascading secondary incidents that can multiply the harm from a single moment of inattention.
With fewer injury-causing crashes, we’re looking at hundreds of situations where secondary accidents were also likely prevented, emergency response resources weren’t needed, and traffic flow wasn’t disrupted.
The Path Forward: Scaling Safety Improvements
Waymo has announced plans to expand to additional cities and increase fleet sizes in existing markets. Each expansion brings proven safety technology to new communities. If Waymo’s current safety performance scales linearly—and there’s no reason to believe it wouldn’t—every additional million miles driven represents several injury crashes prevented compared to human-driven miles.
In 2025, Waymo hit 14 million driverless miles. Simply put, it tripled its autonomous rides to 14 million this year, logging 3.8 million hours and avoiding 18 million kilograms of CO2 emissions. In the Waymo safety impact report, the company reports ten-fold drop in serious crashes versus human drivers and one million autonomous rides per month this spring.
Expansion plans include 20 more cities in 2026, including Tokyo and London.
Waymo is on track to exceed 20 million life-time rides by the end of 2025.
You May Also Like:
Waymo Service Areas in the US: A Definitive Guide
6 Best Self-Driving Cars in the US (2025)
Top 5 Autonomous Trucking Companies in the US (2025)

I’m Dr. Brandial Bright, also known as the AVangelist. As a dedicated and passionate researcher in autonomous and electric vehicles (AVs and EVs), my mission is to educate and raise awareness within the automotive industry. As the Founder and Managing Partner of Fifth Level Consulting, I promote the adoption and innovation of advanced vehicle technologies through speaking engagements, consulting, and research as we progress to level 5 fully autonomous vehicles.